

The problem: your forecast looked right, but the launch still missed
Six months after launch, the numbers do not add up.
Your forecast assumed steady uptake. Early physician interest was strong. Internal alignment was solid. Yet scripts are lagging, access is uneven, and competitors have moved faster than expected.
This is not unusual. A large share of drug launches underperform expectations, often by a wide margin. The issue is not lack of data. It is how the forecast was built and used.
Most forecasts still behave like static revenue models. Real launches do not.
In practice, launch performance is shaped by shifting access, competitive response, and execution quality. If your model does not move with those forces, it will break when they do.
Why launch forecasts fail in competitive markets
They treat demand as independent of access and competition
Most forecasts start with epidemiology, layer in analogs, and apply an uptake curve. This builds a clean demand picture.
The problem is that real demand is gated.
Payer restrictions, prior authorizations, site-of-care constraints, and diagnostic bottlenecks determine how much of that demand becomes actual treated patients. At the same time, competitors adjust contracts, messaging, and field deployment in response to your launch.
In practice, demand is not a fixed input. It is shaped continuously by access and competition.
Business impact: Overestimating reachable patients leads to inflated early revenue expectations and misallocated field and inventory investments.
They assume linear adoption in a non-linear system
Forecasts often assume smooth uptake curves. Real launches are uneven.
Access wins unlock sudden growth. A competitor’s contracting move can stall momentum overnight. A label nuance can shift prescribing behavior in specific segments.
Early launch performance is often bursty, not gradual.
Business impact: Linear assumptions mask timing risk. This affects cash flow, supply planning, and investor expectations.
They over-rely on analogs without adjusting for context
Analogs are useful. But they are often used too literally.
A prior launch may look similar on paper, but differ in key ways: site of care, diagnostic requirements, pricing, or payer scrutiny.
In crowded categories like immunology or oncology, small differences in label or positioning can materially change uptake.
Business impact: Analog selection bias leads to structurally wrong forecasts that look credible but fail under real-world conditions.
They separate forecasting from execution reality
Forecasts are often built by analytics or finance teams and then handed to commercial teams.
This creates a gap. The model assumes a level of execution that may not be achievable.
Field force readiness, patient support infrastructure, and medical engagement all influence how quickly demand converts.
Business impact: The forecast becomes a planning artifact, not an operating tool.
What actually drives forecast accuracy
1. Model the full conversion funnel, not just demand
A strong forecast separates three layers:
- Total Eligible: The epidemiology-based population (The “Paper” Market).
- Diagnosed/Seeking Care: The clinical and diagnostic bottleneck.
- Reachable (Access-Cleared): The Payer/PBM gatekeepers (The “Actual” Market).
- Treated (The “Actuals”): The execution reality shaped by persistence and site-of-care.
Each layer has its own constraints.
For example, in a specialty launch:
- Eligible patients may be large
- Reachable patients may be limited by diagnostics
- Treated patients may be constrained by payer approval rates
In practice, most forecast error sits between eligible and treated patients.
What works: Build explicit assumptions for each conversion step and stress test them independently.
2. Treat access as a primary driver, not a downstream adjustment
Access is often modeled late as a discount or adjustment factor.
That approach misses how access shapes uptake speed.
Formulary tiering, step edits, and reimbursement timelines directly influence prescribing behavior. These are not financial adjustments. They are adoption drivers.
What works: Model uptake separately by access tier. Build scenarios where access evolves over time, not as a fixed assumption.
Pro-Tip: Don’t let your forecast fall into the “GTN Trap.” When access is modeled as a simple discount late in the process, you miss the impact of Gross-to-Net (GTN) leakage —where 340B pricing, PBM rebates, and ASP lag can erode the “Treated Patient” value before it ever hits the top line.
3. Forecast competition as a dynamic system
In competitive markets, your forecast must include competitor behavior.
This includes:
- Timing of rival launches
- Contracting strategies
- Label differentiation
- Field force intensity
Competitors do not stay static. They react.
What works: Use scenario trees that include competitor responses, not just competitor presence.
4. Move to monthly, segment-level forecasting
Annual forecasts hide critical dynamics.
Early launch performance is shaped at the segment level:
- Specific physician groups
- Centers of excellence
- Geographic access differences
Monthly granularity allows you to capture:
- Access wins or losses
- Segment-specific adoption
- Early competitive impact
What works: Shift to monthly forecasts 2–3 years before launch and maintain that cadence through the first 12 months post-launch.
Forecasting as a Decision System, not a Model
The most effective organizations treat forecasting as an operating system for launch decisions.
A forecast only becomes an operating system when it is centralized. By moving to an enterprise platform like ForecastIQ, organizations create a ‘Single Source of Truth.’ This ensures that when the Market Access team updates a payer constraint, the Finance and Supply Chain teams see the impact instantly, rather than waiting for the next monthly slide deck.
This transition requires moving beyond the “Excel Graveyard”—fragmented, manually updated spreadsheets that create silos between finance and commercial teams. Accuracy requires a Single Source of Truth platform where data pipelines are automated and assumptions are transparent across the organization.
The ‘Excel Graveyard’—where dozens of versions of a forecast live in disconnected spreadsheets—is where execution dies. Solutions like ForecastIQˇs Excel Bridge allow teams to keep the flexibility of their custom Excel engines while adding the enterprise-grade governance, version tracking, and audit trails required for high-stakes launch planning.
How this changes behavior
The forecast is used to decide:
- Field force sizing and deployment
- Market access investment
- Patient support capacity
- Evidence generation priorities
Weak organizations use the forecast to secure budget approval. Strong ones use it to allocate resources dynamically.
Contrarian insight: Forecast accuracy improves less from better math and more from tighter linkage between forecast assumptions and execution reality.
Scenario Planning: Where Real Value is Created
Single-point forecasts are fragile.
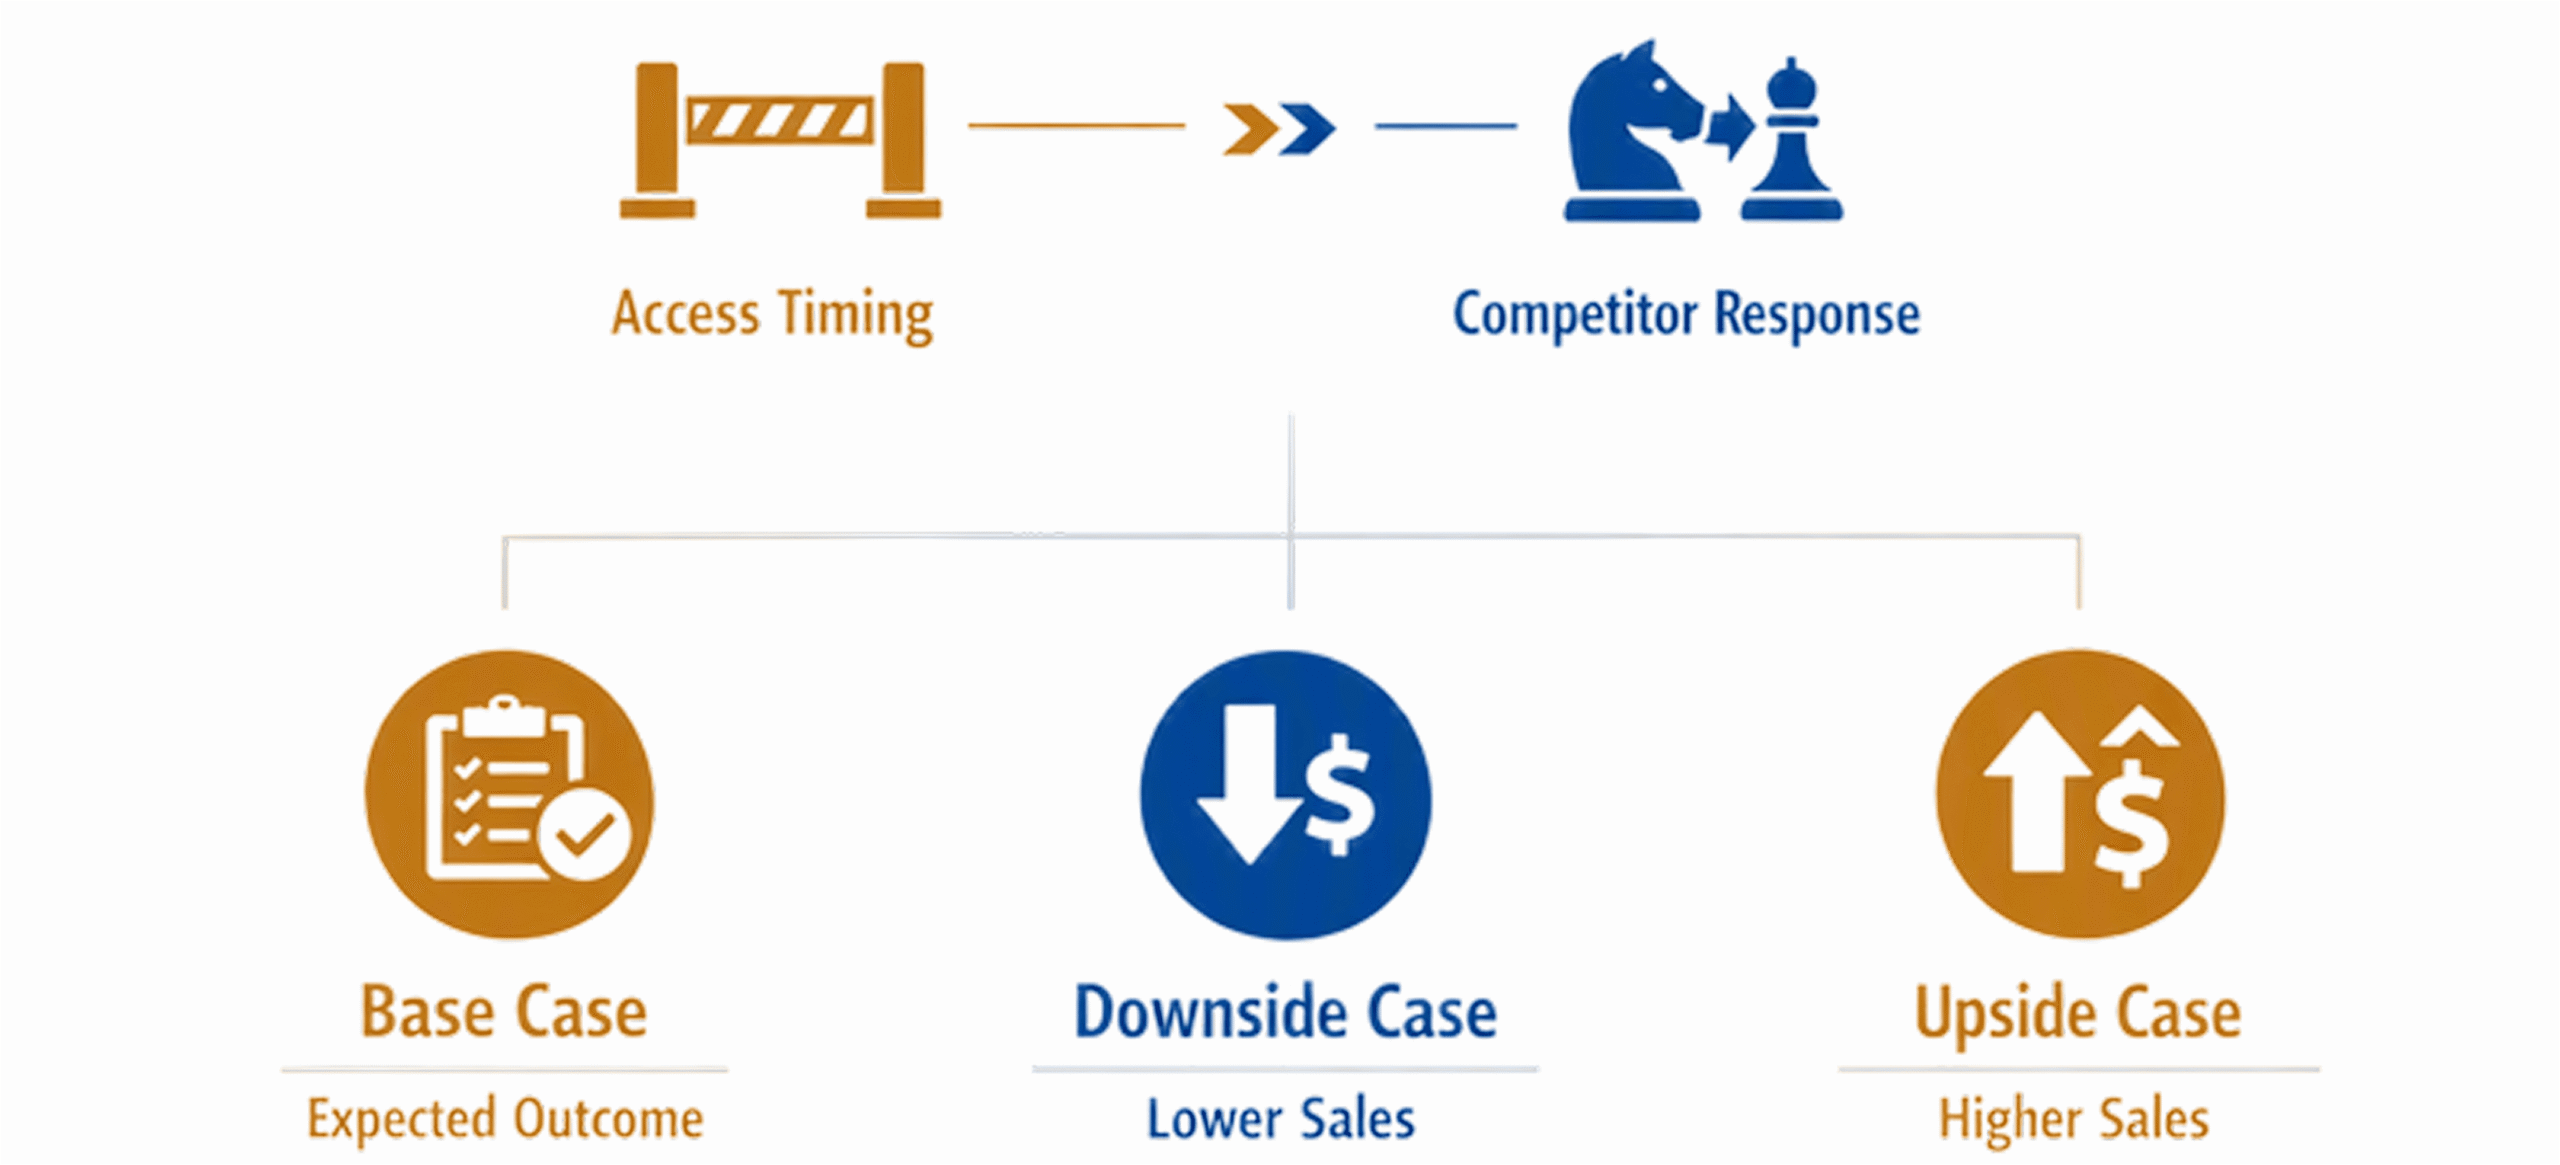
The most useful forecasts define a range of outcomes based on key uncertainties:
- Access timing
- Competitor moves
- Execution effectiveness
Building practical scenarios
Move away from deterministic modeling (predicting a single number) toward probabilistic/stochastic scenarios. This allows you to quantify the “What if?” of a competitor’s label expansion or a six-month delay in formulary inclusion.
A useful structure includes:
- Base case: Most likely combination of access, competition, execution
- Downside case: Delayed access, strong competitor response
- Upside case: Faster access unlock, differentiated positioning
Each scenario should explicitly state:
- Patient conversion rates
- Access assumptions
- Competitive dynamics
What works: Link each scenario to operational decisions. For example, what triggers additional investment or cost control.
Real-world evidence as a forecast correction engine
Pre-launch forecasts rely on assumptions. Post-launch data replaces them.
Real-world evidence helps refine:
- Actual treated population
- Switching behavior
- Persistence curves
- Site-of-care dynamics
In practice, the best teams build RWE feedback loops into the launch plan before approval.
Example
A launch in a metabolic disease category may initially underestimate persistence. Early claims data shows longer treatment duration, increasing lifetime value per patient.
Without a feedback loop, this insight comes too late.
What works: Define in advance which data signals will trigger forecast updates.
Trigger-based forecast refresh: what to update and when
Most forecasts are updated on a fixed cadence. That is too slow.
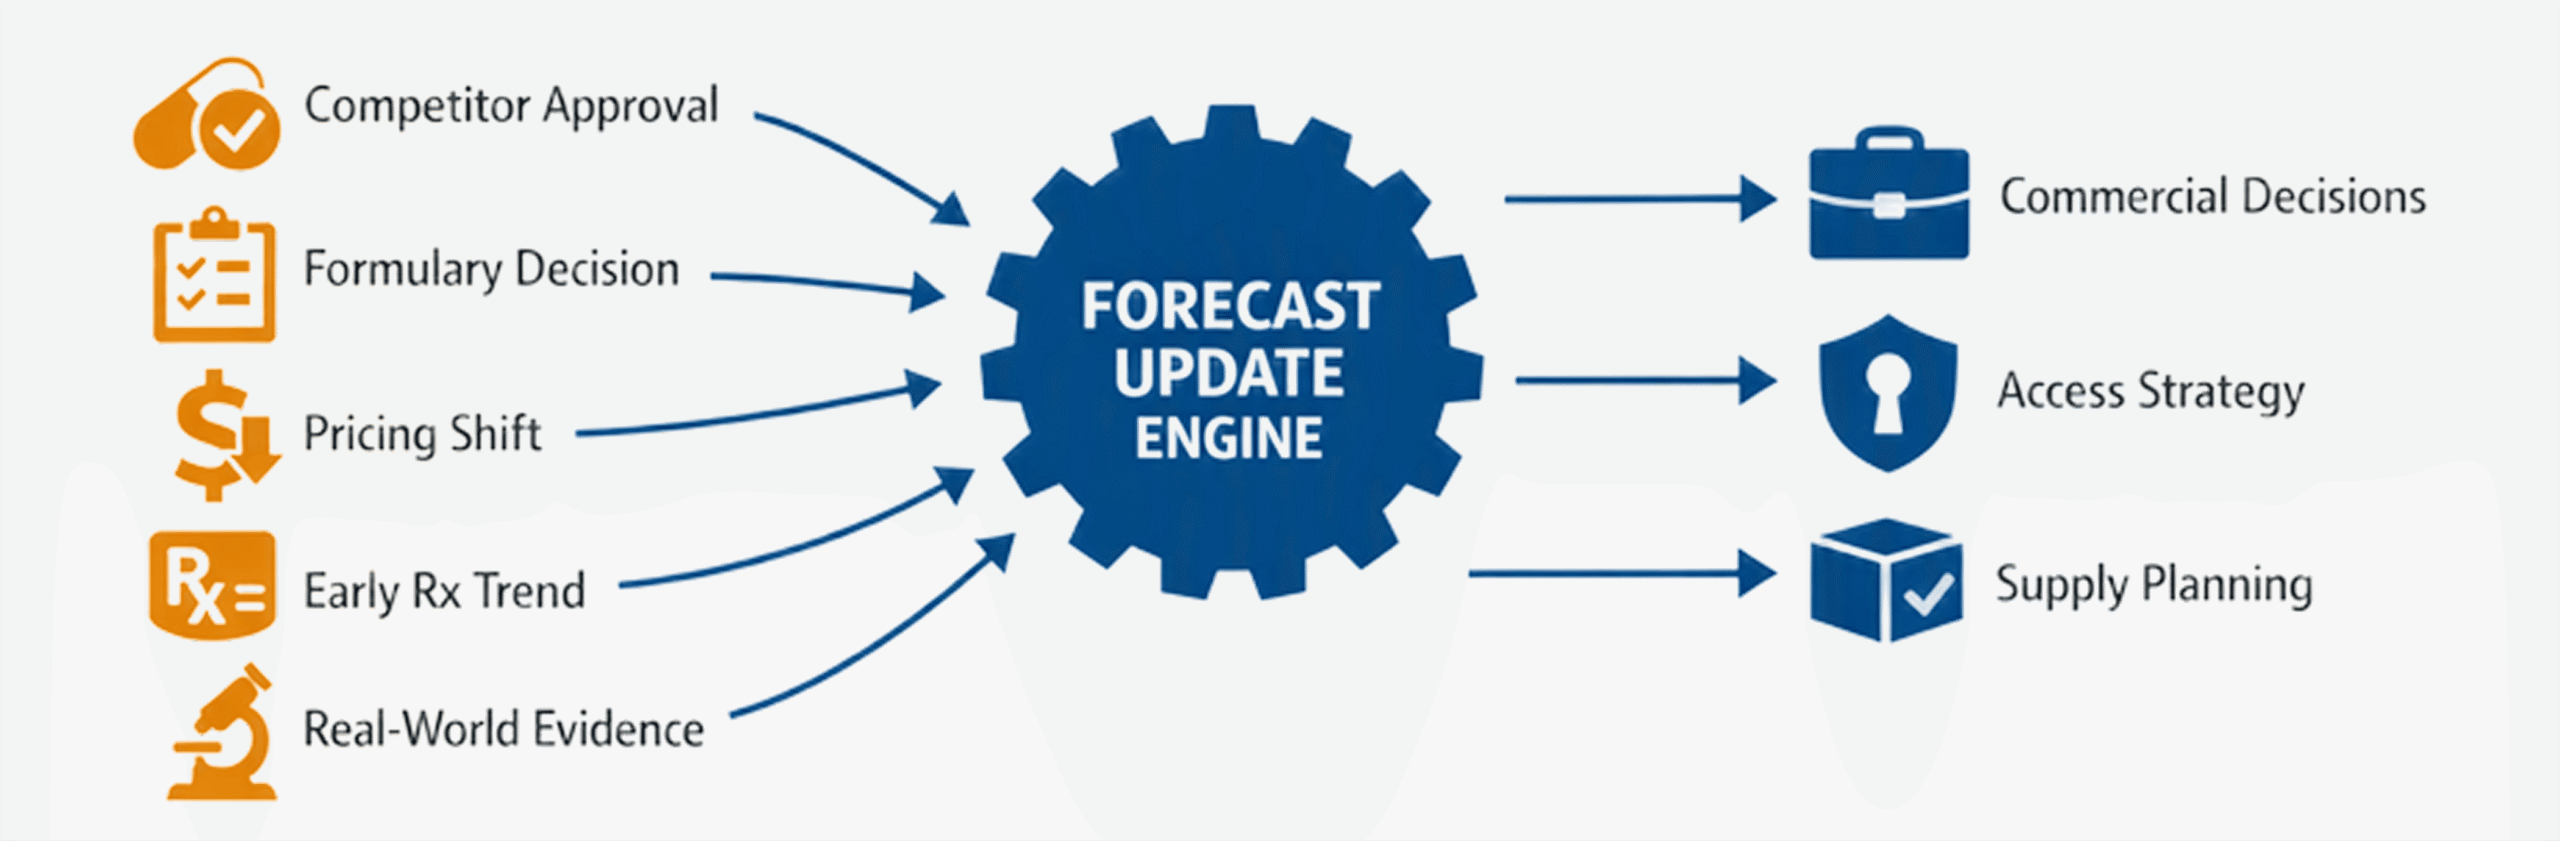
A better approach is trigger-based updates.
Key triggers include:
- Competitor approval or label expansion
- Formulary decisions
- Pricing or contracting shifts
- Early prescription trends
- RWE insights
Each trigger should map to specific model changes.
What works: Define ownership for each trigger and ensure updates happen within weeks, not quarters.
Archetype-specific forecasting: one model does not fit all
Not all launches behave the same.
Common archetypes include:
- Rare disease, science-led launches
- Primary care, share-of-voice driven launches
- Specialty launches with access constraints
Each archetype requires a different modeling approach.
For example:
- Rare disease forecasts focus on patient identification and diagnosis
- Primary care forecasts emphasize field force and awareness
- Specialty forecasts depend heavily on access and site of care
What works: Align forecast structure with launch archetype early in development.
Where forecast error is most costly
Not all errors are equal.
The most expensive errors typically occur in:
- Access assumptions
- Competitive response timing
- Early adoption rates
These errors drive:
- Overproduction or stockouts
- Misallocated commercial spend
- Missed revenue targets
Contrarian insight: The biggest risk is not overestimating demand. It is overestimating how quickly demand can be unlocked.
Practical checklist for improving forecast accuracy
In practice, high-performing teams consistently do the following:
- Separate eligible, reachable, and treated populations
- Model access as a dynamic driver
- Build competitor response scenarios
- Use monthly, segment-level forecasting
- Link forecast assumptions to execution plans
- Define trigger-based refresh mechanisms
- Incorporate RWE early and continuously
This does not eliminate uncertainty. It makes it visible and manageable.
Outcome: what a strong forecast actually delivers
A strong forecast does not predict a single number.
It provides:
- A range of outcomes with clear drivers
- Early warning signals for underperformance
- A basis for dynamic resource allocation
- Alignment across commercial, medical, and access teams
Most importantly, it reduces expensive surprises.
How Chryselys Can Help with Drug Launch Forecasting
Most organizations do not struggle with building a forecast. They struggle with making it usable.
Chryselys focuses on the execution layer where forecasts often break.
This includes:
- Connecting forecasting models to real commercial decisions
- Building segment-level, access-driven forecasting frameworks
- Designing trigger-based refresh systems that respond to market events
- Integrating real-world data into post-launch forecast correction
In practice, the goal is simple.
Make the forecast a tool that commercial teams trust and use, not just a number that finance tracks.
At Chryselys, we donˇt just consult; we provide the infrastructure for accuracy. Our ForecastIQ platform, featuring our proprietary Excel Bridge, was designed specifically to solve the ‘Excel-to-Enterprise’ gap. We help you maintain the modeling flexibility you need while providing the visibility, governance, and data automation required to win in competitive markets.
FAQs
1. How do you forecast drug launch performance when payer access is uncertain?
Start by modeling access as a set of scenarios, not a fixed assumption. Build separate uptake curves for different access tiers such as unrestricted, restricted, and non-covered segments. Assign probabilities to each scenario based on payer behavior and comparable launches. In practice, the key is to link access timing to patient conversion rates, since delays in formulary inclusion or prior authorization requirements directly slow adoption and reduce early revenue realization.
2. What is the best way to model competitive response in a pharma launch forecast?
Model competition as a dynamic variable with defined response scenarios. Include competitor actions such as contracting changes, label expansions, and increased field force activity. Use scenario trees to simulate how these actions affect market share and adoption curves. In practice, competitive response often changes prescribing behavior faster than expected, so forecasts should include timing assumptions for when these responses occur and their impact on segment-level uptake.
3. Why do so many drug launch forecasts miss analyst expectations?
Most forecasts miss because they overestimate reachable patients and underestimate access friction and competitive pressure. They also assume linear adoption when real launches are uneven and segmented. In practice, the largest errors come from optimistic assumptions about payer access and early physician conversion. Forecasts that fail to separate eligible, reachable, and treated populations tend to systematically overstate early revenue.
4. How does real-world evidence improve launch forecasting after approval?
Real-world evidence refines key assumptions such as patient identification rates, treatment switching behavior, and persistence curves. Claims and EHR data provide visibility into actual treated populations and care pathways. In practice, incorporating RWE allows teams to recalibrate forecasts based on observed behavior rather than pre-launch assumptions, improving accuracy in the first 6 to 12 months post-launch and supporting better resource allocation.
5. What early launch signals predict whether a drug will underperform?
Key early signals include slower-than-expected access wins, low approval rates from payers, weak conversion from initial prescriptions to sustained therapy, and strong competitive counter-moves. Segment-level performance is particularly important, as underperformance in high-value segments often drives overall shortfall. In practice, tracking these indicators at a monthly level allows teams to identify gaps early and adjust strategy before revenue impact becomes irreversible.