

A practical guide for pharma marketing executives on how MMX measures channel ROI, why average and marginal returns tell different stories, and how short-term and long-term ROI together reveal the true value of your promotional investment.
The Problem: Spend Is Visible. Impact Is Not.
Most pharma brand teams can quantify spend precisely. What they still struggle to explain with confidence is what each investment actually drove.
Three issues make this difficult:
- Multiple channels influence the same physician simultaneously
- Marketing effects are delayed by weeks or months
- Prescribing behaviour carries its own momentum, independent of promotion
In practice: Standard reporting cannot untangle these dynamics. Without separating them, ROI is guesswork dressed up as measurement. This is exactly what Market Mix Modeling (MMX) is built to solve.
What ROI Actually Means in MMX
In pharma MMX, ROI is straightforward in definition: revenue generated by a channel divided by the total cost of its promotional activity.
What makes it powerful is how that revenue figure is derived. It comes directly from the model — from response curves that quantify incremental prescriptions generated by each channel after controlling for:
- Base demand and brand equity
- Sales carryover from past prescribing behaviour
- Other channels running in parallel
- Competitive activity and external factors
In practice: Without MMX, channels that run during high-prescription periods get credited for sales they did not cause. With MMX, attribution is statistically grounded. The difference in ROI estimates between the two approaches can be substantial — and budget decisions that follow are correspondingly different.
Where ROI Is Calculated: Two Levels of Granularity
Channel-Level ROI
Aggregates total incremental sales across all HCP segments divided by total channel cost. Useful for leadership reporting and high-level budget comparisons.
Channel-Segment Level ROI
Because pharma MMX runs at the HCP segment level — grouping physicians by specialty, decile, geography, and prescribing patterns — ROI is available at each channel-segment intersection.
A channel might show healthy overall ROI while being:
- Over-invested in low-decile, low-response segments
- Under-invested in high-potential segments where it could do more
In practice: Teams that only look at channel-level ROI make blunt decisions – increase or cut a channel wholesale. Segment-level ROI enables surgical adjustments with the same total budget generating meaningfully higher returns.
How Transformation Types Shape the ROI You Measure
ROI is not independent of modelling choices. The transformation applied to a channel’s activity data directly shapes its ROI profile:
- Negative exponential: ROI compresses sharply as activity approaches the asymptote — a hard ceiling on response
- Log / Power: No ceiling, ROI declines more gradually — but needs careful handling in optimisation
- S-curve: ROI is low below the threshold, strong in the mid-range, then compresses at saturation
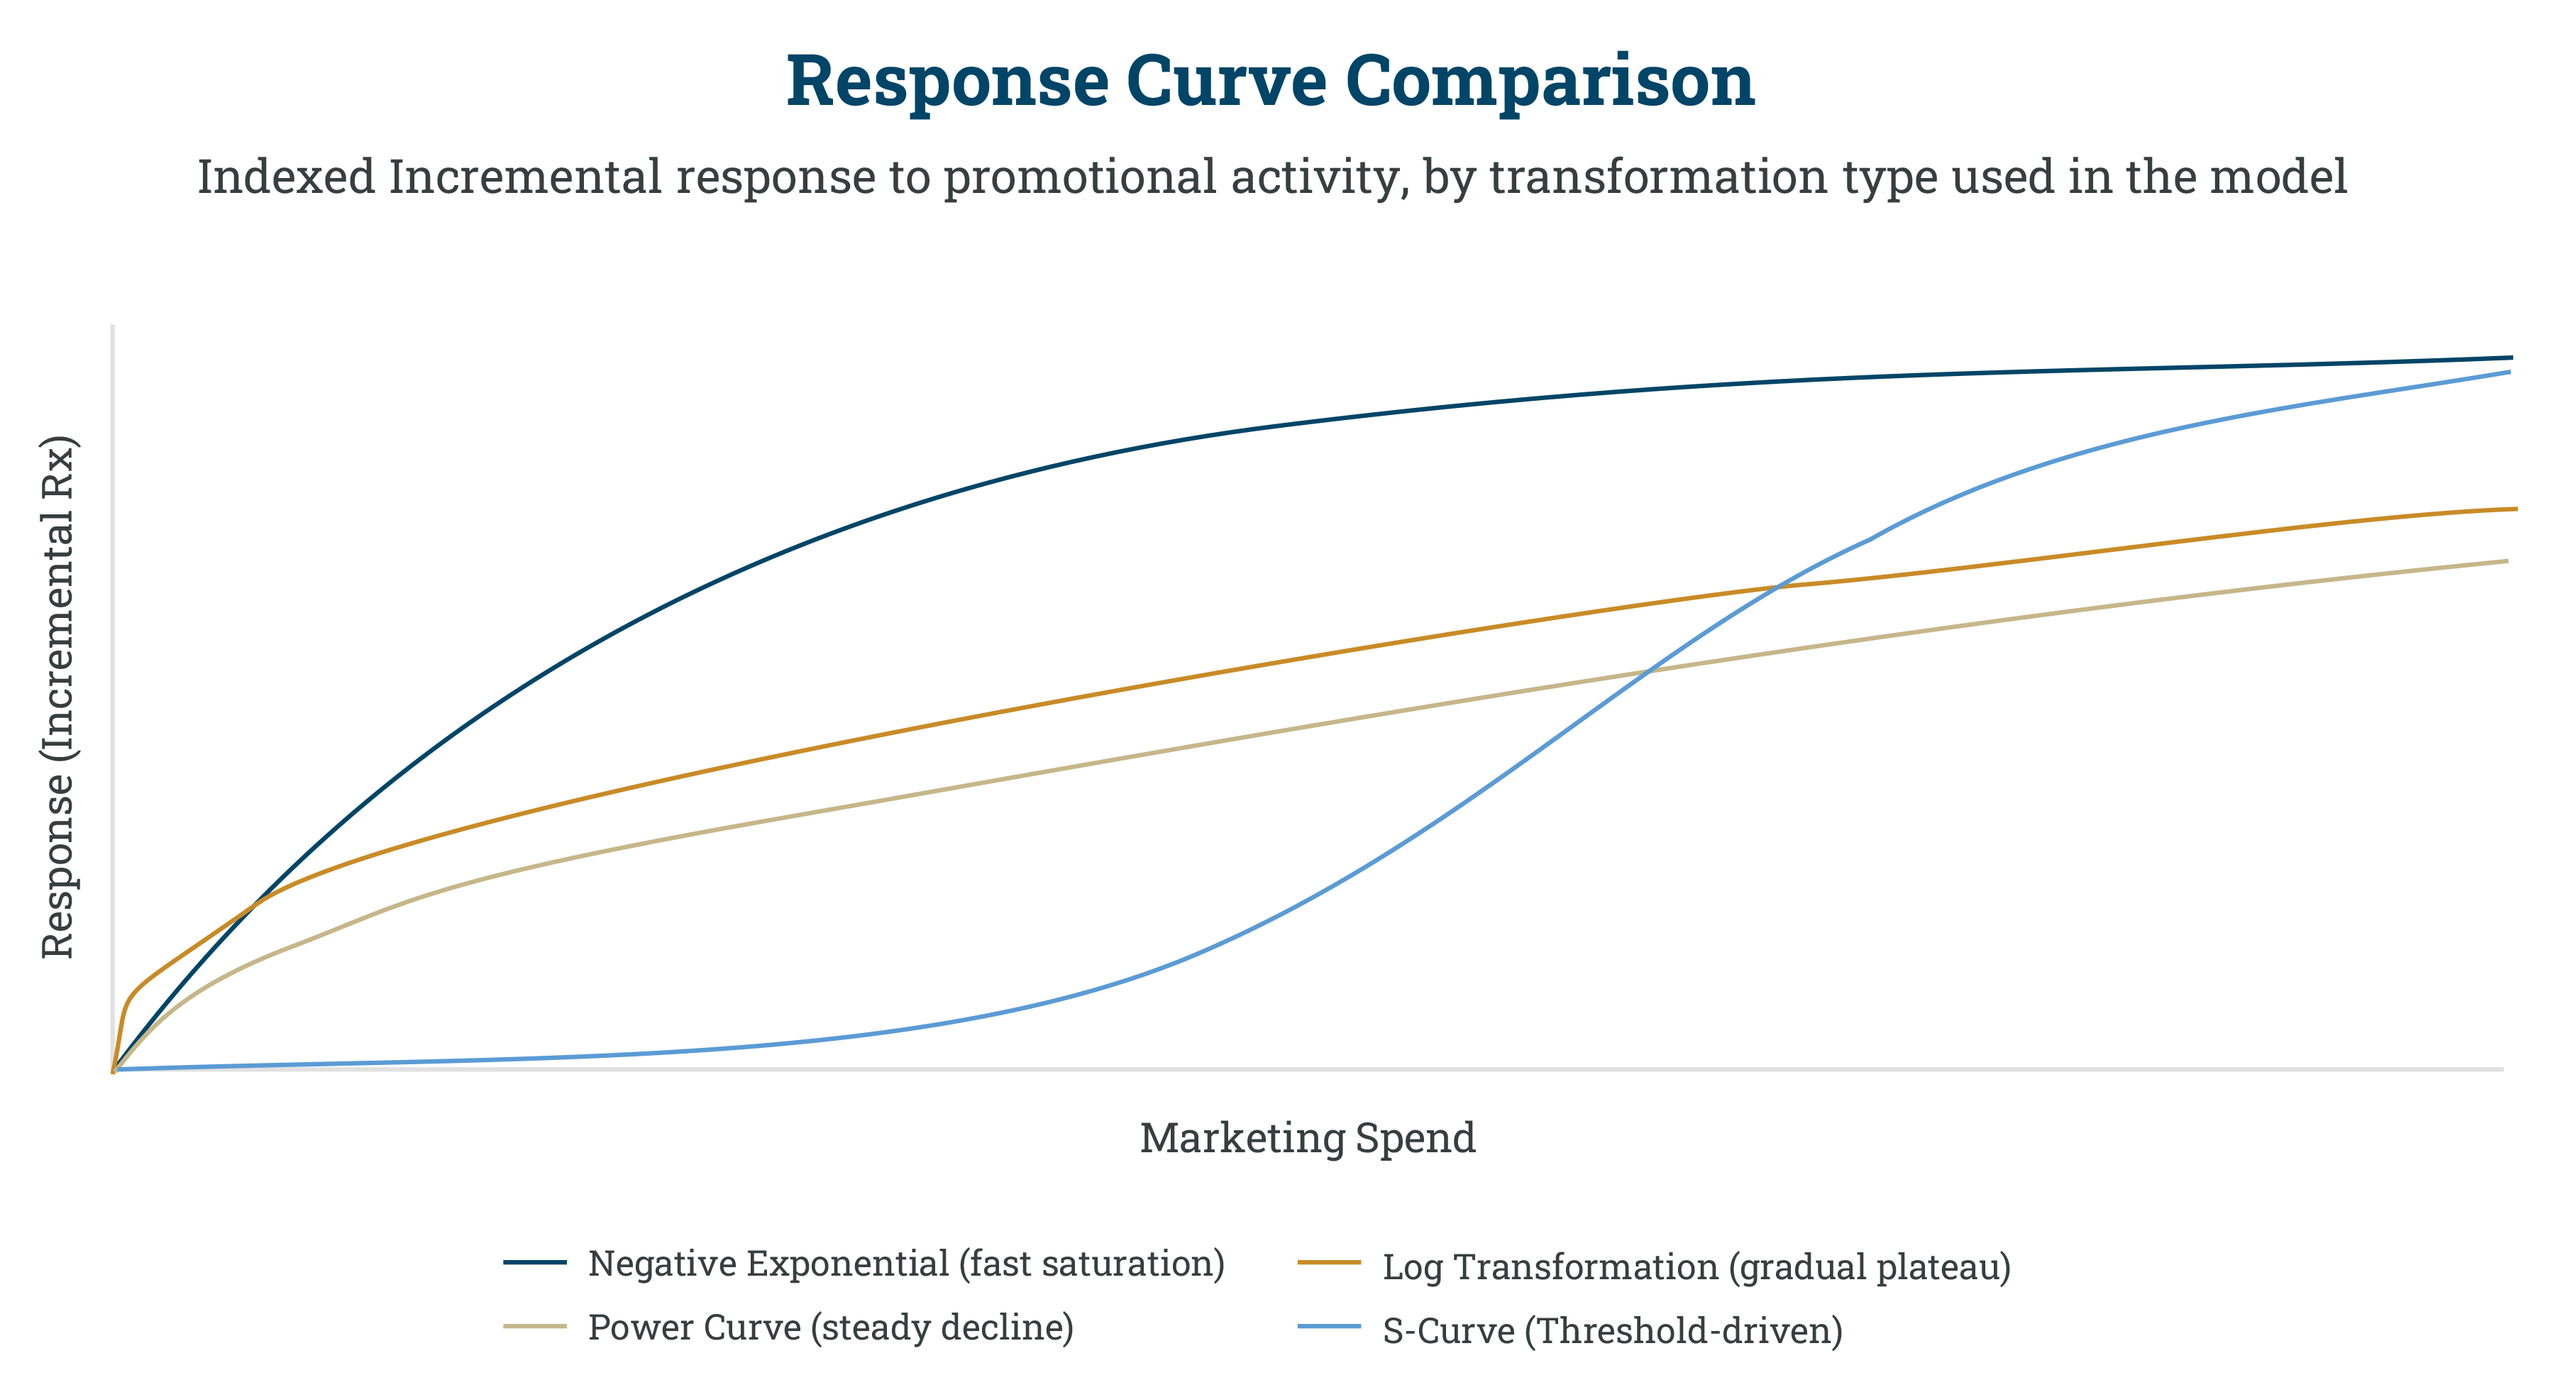
In practice: The wrong transformation does not just affect model fit — it distorts the ROI estimate and the budget allocation that follows. A channel modelled with the wrong curve can appear more or less efficient than it actually is, redirecting spend in the wrong direction.
ROI vs MROI: Two Metrics, Two Different Decisions
These are related but answer different questions. Confusing them leads to poor planning.
ROI — Average, Retrospective
Measures what a channel returned per unit of investment over the historical period. Useful for comparing channel efficiency and reporting to leadership.
MROI — Marginal, Forward-Looking
Measures the incremental return from the next unit of spend at the current position on the response curve. Because of diminishing returns, MROI decreases as spend increases along the curve.
Average ROI follows a similar pattern beyond the optimal spend point. The nuance: for S-curve channels, ROI can start low at minimal activity (below the threshold), rise through the productive mid-range, then compress again at high spend. It does not decrease uniformly from zero.
In practice: A channel with high historical ROI is not automatically a candidate for more investment. If it is already deep into diminishing returns, its MROI may be low. ROI tells you how efficiently you used past budget. MROI tells you where the next unit of budget should go.
Short-Term vs Long-Term ROI
Most ROI calculations only capture the immediate, in-period response. This is often an incomplete picture.
Short-Term ROI
Captures sales generated during the period of active promotion. For high-decay channels like digital display, this reflects most of the total value — the effect fades quickly.
Long-Term ROI
Accounts for carryover effects that persist after promotion ends. A physician detailed in Q3 may continue prescribing at an elevated rate in Q4 and beyond — driven by the residual influence of that interaction.
Long-term ROI is estimated using the adstock decay rates calibrated in the model, projecting accumulated return beyond the active promotion window.
In practice: Channels like rep detailing, CME programmes, and congress engagement have slow decay rates. Their long-term ROI can be substantially higher than short-term ROI — sometimes by a factor of two or more. Budget cuts based purely on short-term ROI systematically undervalue these channels and bias spend toward faster-decay channels that look better in a single-period view but deliver lower total returns.
From ROI Measurement to Budget Optimization
ROI measurement is retrospective. Optimization is where the commercial value of MMX is actually realized.
The response curves and ROI estimates feed directly into the optimizer, which identifies the budget allocation that maximizes returns within defined constraints. Common scenarios include:
- Budget reallocation: same total spend, smarter distribution across channels and segments
- Sales target planning: how much investment is needed to hit a specific Rx goal
- Blue-sky scenario: unconstrained optimization that reveals the brand’s commercial ceiling
- MROI threshold planning: set a floor on acceptable returns and see what that implies for total spend
In practice: The most valuable output is often not the optimal allocation itself — it is the comparison with historical spend. Seeing where current investment deviates from the efficient frontier gives commercial teams the evidence to challenge legacy budget patterns and make the case for a change.
Making MMX Accessible: The Case for a Productized Platform
Measuring ROI with MMX is not a one-time exercise. Markets shift, channels evolve, and the ROI landscape looks different every six to twelve months. Most organizations do not struggle with building a model. They struggle with sustaining it.
Common failure points:
- Rebuilding data pipelines from scratch each refresh cycle
- Losing historical context when team members change
- Insights locked inside analytics teams, inaccessible to brand teams
- No systematic way to compare ROI across refresh periods
Chryselys operationalises the entire MMX process within a single platform — from data ingestion to boardroom-ready ROI insights. It allows commercial teams to:
- Reuse model configurations and preserve historical analyses
- Compare ROI results systematically across refresh cycles
- Run optimization scenarios without rebuilding the process each time
- Access insights continuously, not just at the end of a consulting engagement
In practice: The platform’s GenAI business translator enables marketing executives to explore ROI, MROI curves, and optimization scenarios in plain language — without needing to understand the statistical machinery behind them. The analysis speaks the language of the business, not the other way around.
The Bottom Line
Measuring ROI of pharma marketing channels is not about generating a number for the annual review. It is about building a rigorous, evidence-based understanding of which channels are working, at what level of investment, and over what time horizon.
Teams that succeed with MMX use it to:
- Measure channel impact at the segment level, not just in aggregate
- Separate short-term and long-term returns to avoid undervaluing durable channels
- Use MROI — not just ROI — to direct the next unit of budget
- Embed the analysis into regular planning cycles, not one-off engagements
The advantage is not data availability. It is consistent, evidence-based decision-making — every planning cycle, not just once a year.
FAQs
1. How is ROI in pharma MMX different from standard marketing ROI?
Standard marketing ROI attributes revenue based on last-click or share-of-voice logic. In pharma MMX, revenue attribution is model-derived — it reflects incremental prescriptions a channel caused after statistically controlling base demand, sales carryover, competitive activity, and all other channels. It also accounts for delayed effects through adstocking, which standard ROI rarely does. The result is a more conservative but significantly more reliable estimate of what each channel is actually delivering.
2. Should pharma teams prioritize channels with the highest ROI or the highest MROI?
For future investment decisions, MROI is the more relevant metric. High historical ROI tells you a channel has been efficient in the past — but if it is already saturated, the return on the next unit of spend will be low regardless. MROI tells you where additional investment will generate the most incremental return right now. In practice, channels with moderate ROI but high MROI are often the most undervalued in traditional budget reviews.
3. How significant is the gap between short-term and long-term ROI for pharma channels?
It varies by channel and decay rate. For high-decay channels like digital display, short-term and long-term ROI are close. For low-decay channels like field force detailing or Continuing Medical Education (CME) programmes, long-term ROI can be substantially higher — sometimes by a factor of two or more. Budget decisions based solely on short-term ROI will consistently undervalue these channels and bias to spend toward faster-decay channels that deliver lower total returns.
4. How does HCP segmentation affect the ROI estimates produced by MMX?
Significantly. High-decile and low-decile prescribers often respond very differently to the same promotional input. The aggregate channel-level ROI averages these differences out, which can be misleading. Segment-level ROI enables targeted decisions — increasing investment where returns are strong, pulling back where the channel is not working — rather than blanket decisions applied to the entire HCP universe.
5. How often should pharma teams refresh their MMX ROI estimates?
For most brands, every six to twelve months — aligned to planning cycles, so updated ROI estimates directly inform the next budget round. Brands navigating competitive launches or significant channel shifts may need more frequent refreshes. The key is ensuring each refresh builds on preserved historical analyses rather than starting from scratch, so teams can track how channel efficiency is evolving over time — not just what it looks like at a single point.