

The measurement problem no one wants to admit
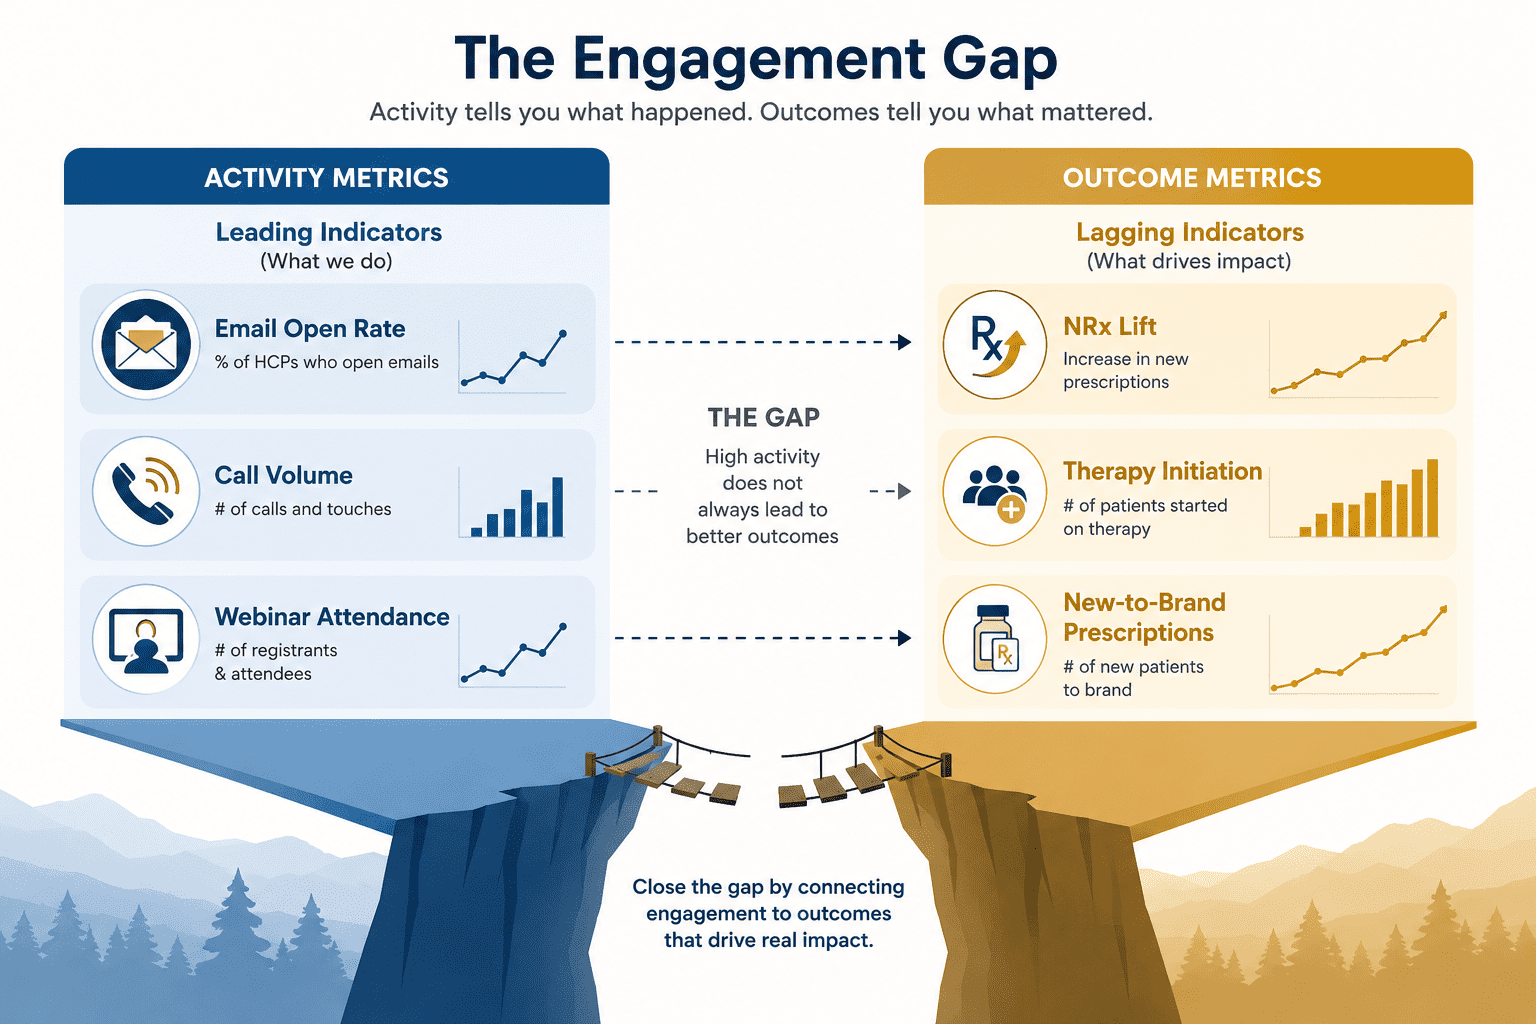
A regional VP at a mid-sized pharma company once described her reporting stack as “a confidence machine.” Every Monday, she received dashboards showing call completion rates, email open rates, webinar registrations, and portal visits. All trending up. Meanwhile, new-to-brand prescriptions in her most-targeted segment had been flat for six months.
She was not short on data. She was short on the right data.
This is the core tension in HCP engagement analytics today. The tools to measure activity are mature. The tools to connect that activity to clinical behavior are not yet standard practice. And the gap between the two is where budgets disappear without explanation.
These numbers describe a sector that has invested heavily in engagement infrastructure but has not yet built the measurement layer that makes it defensible at the board level.
Why this keeps happening
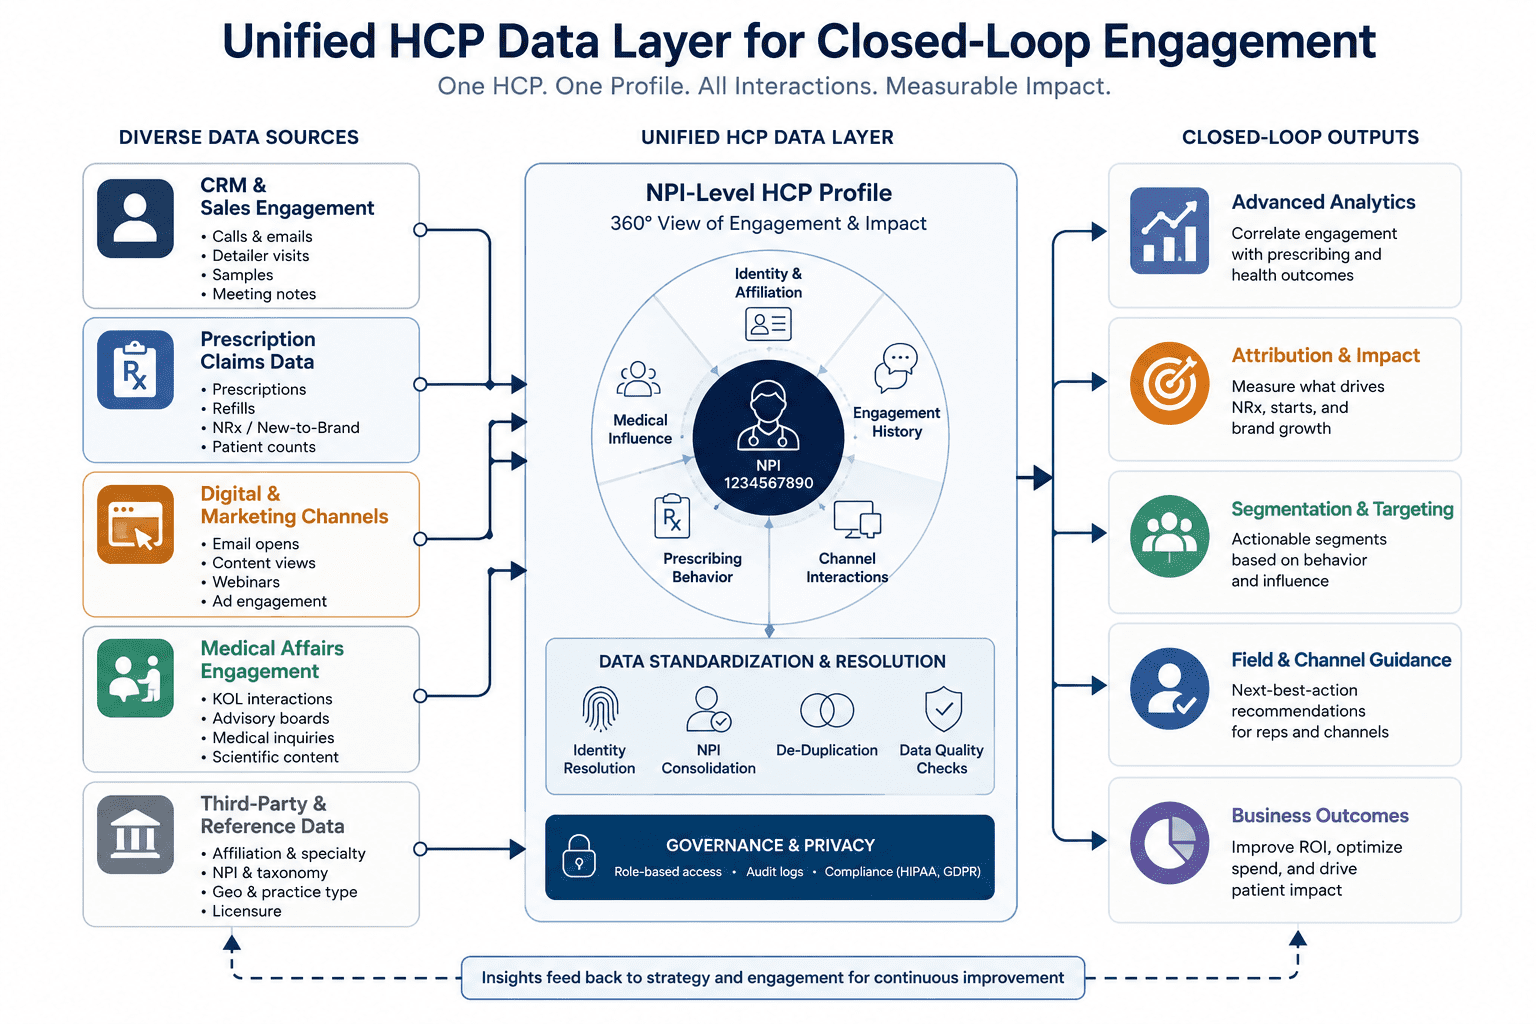
The problem is structural, not analytical. Most pharma commercial teams have their engagement data scattered across four or five disconnected systems: CRM records in Veeva, email metrics in a marketing automation platform, event data in a third-party event tool, prescription trends in IQVIA, and medical affairs interaction logs in a separate database that nobody has connected to anything.
Without a unified HCP record, attribution is impossible. You cannot determine whether the oncologist who started prescribing your product in Q3 was influenced by the rep visit three months earlier, the KOL webinar two months earlier, or the clinical paper she downloaded the week before writing her first script.
There is a second structural issue that compounds the first. Sales, marketing, and medical affairs measure engagement separately, use different KPIs, and rarely share data in any usable form. A medical science liaison’s scientific exchange with a key opinion leader three months before launch is one of the highest-value engagement signals in the entire commercial cycle. Almost no company currently connects it analytically to commercial outcomes.
What it costs
Disconnected analytics does not just create uncertainty. It produces systematic misallocation that shows up in the revenue line.
One anonymized cardiovascular brand allocated 38% of its $17.6 million DTC budget to ZIP codes where the brand had poor formulary access and low HCP engagement, because its analytics team was running five disconnected systems with no unified attribution model. Post-launch analysis put the cost of that misalignment at $6.7 million in wasted spend over 18 months.
A separate immunology brand found that DTC-to-HCP misalignment had reduced patient support program conversion from the industry benchmark range of 68–72% down to 41%. The first-year revenue cost was $8.3 million.
The cost of bad measurement is not just wasted budget. It produces bad strategic decisions: pulling resources from channels that are building preference and doubling down on channels that are merely confirming it.
A measurement framework that connects to outcomes
Effective HCP engagement analytics operates across three layers. Most teams only have the first.
Layer 1: Unified data foundation
Before any analytics conversation, the prerequisite is a single longitudinal HCP record at the NPI level. This means connecting CRM activity, digital engagement history, event participation, prescription claims, and medical affairs interactions into one profile that updates continuously.
In practice, this is harder than it sounds. CRM data often has incomplete fields, dropdown-only call notes that strip out qualitative context, and duplicate HCP records across systems. Analytics built on this foundation produces confident but unreliable conclusions. Fixing the data quality problem is step zero, not step five.
Layer 2: Leading and lagging indicators, clearly separated
Leading indicators tell you whether your engagement is reaching physicians and holding attention. Lagging indicators tell you whether that attention changed clinical behavior. Both matter, but they answer different questions and should never be conflated.
- Leading: Content engagement depth, return visit rate, email click-to-dwell ratio, event participation quality, rep-to-HCP content sharing rate
- Lagging: New-to-brand prescriptions (NRx), therapy initiation rates, diagnostic test ordering patterns, formulary pull-through, time-to-first-script after engagement
Most pharma analytics programs measure only leading indicators and call the optimization work done. The lagging indicators require connecting engagement data to claims data, which requires the unified NPI-level record described above. This is why the two layers are not sequential tasks. They depend on each other.
Layer 3: Closed-loop attribution and sequencing intelligence
This is where most teams aspire to be and where almost none currently operate at scale. Closed-loop attribution connects every engagement touch, in the order it occurred, to a downstream prescribing signal. It answers the question that matters: which combination of touchpoints, in which sequence, drove adoption for which HCP segment?
The answer is rarely what intuition suggests. AI-driven multi-touch attribution analysis of real commercial programs has found that sequences like scientific webinar, followed by rep visit three weeks later, followed by digital content push produce meaningfully different NRx outcomes than the same touches in a different order or as stand-alone interventions. Volume-level channel analysis does not surface this. Sequencing analytics does.
Companies that have achieved closed-loop measurement at this level report cutting attribution reporting time by 80% and reallocating budget to highest-ROI channels within the first quarter of having the data.
Where most teams actually sit
The honest assessment of the industry is that only about 10% of pharma commercial teams are operating at the data-driven frontier. The rest are distributed across earlier stages of a maturity curve that most organizations are not honest with themselves about.
| Stage | What you have | What you’re missing | % of pharma |
|---|---|---|---|
| Activity tracking | Call logs, email opens, event attendance | Any connection to clinical behavior | Most |
| Channel analytics | Per-channel performance dashboards | Cross-channel attribution, sequencing | Some |
| NPI-level attribution | Engagement linked to individual prescribing behavior | Real-time optimization loops | Few |
| Agentic orchestration | AI coordinates channel sequencing in real time | Still emerging; governance complexity | Rare |
Understanding where your organization sits on this curve is a prerequisite for making sensible investment decisions. The mistake is to buy a Next Best Action platform before the underlying data foundation supports it. NBA outputs are only as reliable as the data they are trained on.
The contrarian case against engagement scores
Custom engagement scores are widely used by pharma commercial teams to compress complex HCP behavior into a single number. A physician who receives three calls, attends a webinar, and opens four emails this month gets a score. That score informs rep prioritization, resource allocation, and campaign sequencing.
The problem is that these scores can mask complexity, and they often encode the wrong thing.
There is a related problem with Next Best Action systems trained on historical CRM data. These models learn which HCPs received the most engagement in the past and tend to recommend continued engagement with the same population. They can entrench resource allocation toward established prescribers while systematically underserving emerging prescribers who have high potential but low historical activity. The model amplifies existing biases rather than correcting them.
The fix is not to abandon engagement scores or NBA systems. It is to validate them against lagging indicators regularly and rebuild the training data with prescribing outcomes, not just engagement history.
What the next two years look like
Two changes are underway that will materially shift how HCP engagement is measured and acted on by 2027.
Free-text capture unlocks qualitative engagement signals
Most CRM systems currently capture field interactions through dropdown menus. An “objection” field has five options. A “meeting quality” field has three. The actual texture of a physician conversation – what she said about adoption barriers, how she reacted to new efficacy data, whether she seemed genuinely interested or was politely ending the meeting – disappears into a selection box.
AI-powered free-text compliance scanning now makes it operationally viable for reps to capture rich narrative notes without compliance risk. The system flags potentially non-compliant entries before submission. When this works at scale, pharma companies will have qualitative signal at the interaction level for the first time, which changes what engagement analytics can detect.
Agentic systems are replacing recommendation engines
The shift from Next Best Action – where a system recommends what a rep should do – to agentic orchestration, where AI coordinates multi-channel engagement in real time without waiting for human review, is underway at the leading edge of the industry. Aktana’s platform, which became part of PharmaForceIQ in January 2026, reports 36% new prescription lift and 19% sales performance improvement after competitor launches across a validated 12-year deployment dataset. These are not pilot results. They are production outcomes from live commercial programs.
However, autonomous AI is only as effective as the data feeding it. If algorithms rely on outdated volume deciles rather than distinguishing between ‘Swing’ and ‘Emerging’ prescribers, they simply execute flawed strategies at machine speed. True orchestration requires a foundation of behavioural, explainable segments before the AI is ever turned on.
Conclusion
HCP engagement analytics is not a reporting problem. It is a commercial performance problem that happens to manifest in bad reports.
The companies that will define the standard over the next three years are not the ones with the most sophisticated dashboards. They are the ones that have done the unglamorous work of connecting their CRM to their claims data, cleaning their HCP records, aligning their sales and marketing and medical affairs teams on shared outcome-based KPIs, and validating their engagement scores against actual prescribing behavior.
Everything else – the AI agents, the next best action recommendations, the NPI-level omnichannel attribution – depends on that foundation being solid. Build it first, and the advanced capabilities compound quickly. Skip it, and you are running sophisticated analysis on unreliable inputs.
The measurement gap is expensive. It is also a solvable problem, and solving it is faster than most commercial leaders expect once the organizational and data prerequisites are in place.
FAQs
1. How do you connect HCP engagement data to prescription outcomes?
Connecting HCP engagement to prescribing behavior requires three prerequisites: a unified NPI-level HCP record that consolidates CRM, digital, and event data; a linkage to prescription claims data (typically via IQVIA or a comparable source); and a multi-touch attribution model that assigns contribution across touchpoints over the prescribing window, which typically spans weeks to months. The most reliable lagging indicators are new-to-brand prescriptions (NRx) and therapy initiation rates, tracked at the individual HCP level against a matched control group that received lower or no engagement.
2. Why do most pharma companies fail to prove HCP engagement ROI?
The primary failure is structural, not analytical. Engagement data lives in disconnected systems, so attribution across channels is impossible. Sales, marketing, and medical affairs each measure engagement independently and use incompatible KPIs. Most teams optimize leading indicators such as email open rates and call completion without connecting them to lagging indicators like NRx lift. According to Fierce Pharma (2025), 69% of pharma companies identify ROI demonstration as their top HCP engagement challenge, and EPG Health found that only 22% of companies act on the data they do collect.
3. What data sources are needed to build a 360-degree HCP engagement view?
A complete HCP 360 profile requires six core data types: CRM interaction history; digital engagement data (email opens, portal visits, content downloads, webinar participation); prescription and claims data linked at the NPI level; medical affairs interaction logs (MSL visits, advisory board participation, scientific query history); event data from congresses and speaker programs; and demographic and specialty data for segmentation. The critical requirement is that all of these are joined at the individual HCP identifier (NPI) and updated continuously, not in monthly batch cycles.
4. How does Next Best Action in pharma differ from traditional HCP targeting?
Traditional HCP targeting typically uses periodic list builds ranked by prescription volume and broad specialty criteria. Next Best Action uses machine learning to analyze real-time signals – including recent digital engagement, prescribing trend shifts, channel preference history, and competitive detailing activity – to recommend the optimal next engagement for each individual HCP. Aktana’s validated deployment data shows 36% NRx lift and 19% sales performance improvement after competitor launches. The prerequisite is a unified HCP data foundation; NBA models trained on incomplete or siloed data produce recommendations that amplify existing biases rather than correcting them.
5. When should a pharma brand invest in a unified HCP engagement analytics platform?
The signal that investment is warranted is when you have high engagement activity but cannot explain prescribing performance in specific territories or segments. The prerequisite is data quality: if your CRM has significant gaps, duplicate records, or dropdown-only call notes, address those first. A platform investment before the data foundation is sound will surface confident but unreliable outputs. The business case is strongest at launch stage, when attribution accuracy directly affects budget allocation, and at the 6-to-12-month post-launch inflection point, when the question shifts from reach to conversion efficiency.
How Chryselys can help with HCP Engagement Analytics?
The primary barrier to effective HCP engagement analytics is structural: commercial teams cannot connect digital activity to clinical outcomes because their data remains siloed across disconnected systems. Analytics built on fragmented data lead to unreliable strategic decisions and misallocated budgets.
Chryselys’ DatafusionIQ resolves this foundational “Layer 1” data challenge to build the single, longitudinal HCP record required for closed-loop attribution, while SmartRep serves as the conversational intelligence layer.
DatafusionIQ: Automated Foundation and Identity Resolution
Instead of manual scripting, DatafusionIQ automates the ingestion of diverse datasets – including CRM activity, marketing metrics, third-party event data, and prescription claims (such as IQVIA or Symphony). The platform standardizes inconsistent layouts, dates, and numerical inputs into a common queryable data model.
To bridge the gap between different vendor identifiers, DatafusionIQ utilizes a multi-stage integration methodology. By combining deterministic matching (exact and relaxed constraints) with probabilistic matching, the platform reconciles patient and HCP records across multiple systems. This resolves identity duplication and establishes a reliable standard record (NPI-level master data) that serves as the foundation for multi-touch attribution.
Continuous Data Quality Management (DQM)
Analytics are only as reliable as the underlying data. DatafusionIQ includes a dedicated Data Quality Management (DQM) Engine that monitors data integrity across Raw, Curated, and Processed zones. The system tracks completeness, accuracy, and anomalies (such as missing values or impossible dates), reporting issues through dedicated dashboards and an accessible configuration UI. This ensures that operations teams can manage data business rules directly, maintaining a clean dataset for downstream analysis.
SmartRep: Conversational Insights & Execution
Sitting directly on top of this mastered data, SmartRep is an AI analysis agent. It allows field reps, managers and home office personnel to query the unified database using natural language, translating questions into optimized, read-only SQL queries which in turn provides responses to the user with clear, concise and actionable insights. SmartRep enables real-time field tactics – such as classifying HCP prioritization or identifying call gaps – while strictly enforcing built-in compliance guardrails such as redactions, geographic exclusions, with database-calculated mathematical precision.
By deploying DatafusionIQ and SmartRep in unison, pharmaceutical organizations can establish the unified data foundation necessary to transition from basic activity tracking to true outcome-based measurement. Ultimately, this approach turns data into a defensible strategic asset—one that moves beyond reporting on what happened to orchestrating what should happen next to drive NRx lift.